Mastering EarthSoft: A Deep Dive into Map Widget Editor Layers for Environmental Data Visualization
Want to effectively visualize environmental data in EarthSoft? This guide provides a comprehensive walkthrough of the Map Widget Editor Layers tab. Learn how to add, edit, and customize your map layers for maximum impact. This article will help you customize the map widget and understand EarthSoft map widget layer options, as well as EarthSoft map configuration.
![]()
Accessing the Map Widget Editor in EarthSoft
First, you'll need to access the Map Widget Editor. Click the "More Options" icon (as shown above) in the upper right corner of the widget and select "Edit". The Map widget properties are organized into six tabs and selecting "Edit" opens the editor. Remember to click "Save" to apply any changes you make!
Understanding the Layers Tab: Your Map's Control Center
The Layers tab is where you manage all the layers in your Map widget. It displays a grid with each layer's name, type, URL, visibility status, and Layer List settings.
Here's what you can do:
- Add new layers.
- Edit existing layers.
- Delete layers.
- Change the display order of layers.
Adding a New Map Layer in EarthSoft: A Step-by-Step Guide
Here’s the general process for adding a new map layer. A new dialog window with "Layer" and "Edit Renderer" tabs will appear. Options vary depending on the layer type you select.
- Click the "Add Layer" icon.
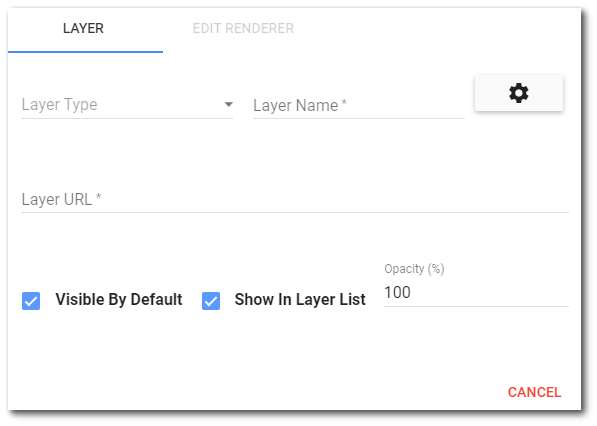
- Choose a "Layer Type" from the dropdown menu.
- Enter a "Layer Name".
- Input the "Web API URL" for the layer, if not automatically populated.
- Decide on default visibility: check "Visible by Default" to show it right away.
- Add the layer to the Layer List menu with the "Show in Layer List" option.
- Adjust the "Layer Opacity" from 0 (fully transparent) to 100 (fully opaque).
- Configure any layer-specific options.
- Set up layer labels, popup templates, and custom renderers
- Click the "Add Layer" button to finalize.
Important URL Note: For map widget layer types, ensure the URL content is allowed. To allow resources from that URL, add the URL to the Content-Security-Policy section of the web.config file for the site.
Available Layer Types: A Detailed Overview
Here’s a breakdown of each available layer type within EarthSoft map configuration:
-
Facility Layer: Choose specific facilities from the "Facility Chooser" to highlight.

-
My EQuIS Facilities: Automatically displays all facilities. Default URL: "api/facilities/FeatureServer/0".
-
User Report: Plot data from a selected report (via "Report Chooser"). Configure report options and a classification scheme.
-
Feature Layer: Plot an Esri Feature Layer using its URL and a display name.
-
ArcGIS Dynamic Layer: Display a dynamic map service utilizing a URL and a desired layer name.
-
ArcGIS Tile Layer: Display a cached map service by inputting the URL and layer name.
-
GeoRSS Layer: Display live web feeds with geographic features.
-
KML Layer: Displays Esri KML layers defined by a URL.
-
Image Layer: Plot an Esri Image map service resource by inputting the URL and layer name.
-
Vector Tile Layer: Plot an Esri Vector Tile layer.
-
CSV Layer: Plot point layers from a CSV file with latitude/longitude data.
-
WMS Layer: Import georeferenced images based on the OGC Web Map Services standard.
-
GeoJSON Layer: Display spatial data based on the GeoJSON format.

Editing or Deleting Existing Layers
To modify an existing layer, select it and click the "Edit Layer" icon. Then change the settings as desired.
![]()
To delete a layer, select it and click the "Delete Layer" icon. Confirm your choice when prompted.
![]()
Customizing Layer Appearance: Labels, Popups, and Renderers
Adding Layer Labels
For compatible layer types, you can add labels. Check the "Enable Layer Labels" box to reveal label properties.
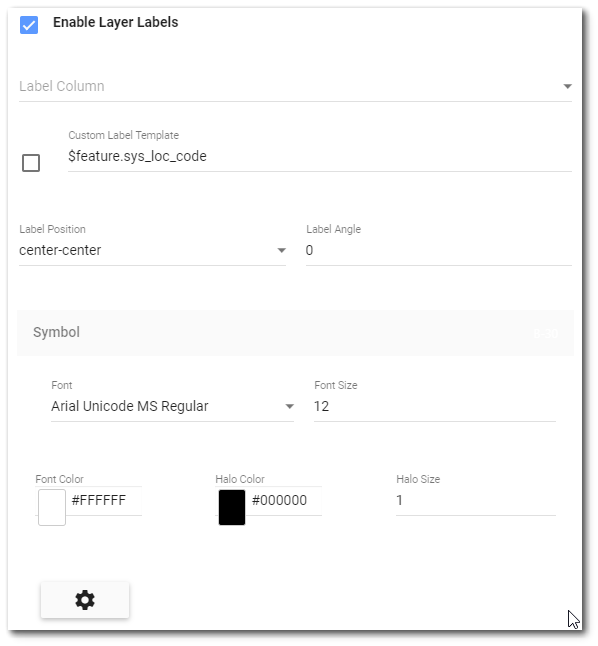
- Label Column: Select the report field to display in the labels (for User Reports).
- Label Template: Craft a custom label template using Esri Arcade script (e.g.,
$feature.sys_loc_code). - Label Position: Position labels relative to the symbol.
- Label Angle: Adjust label rotation.
- Font: Customize font type, size, and color.
- Halo: Add a halo effect for better visibility.
Configuring Popup Templates
Popup templates appear when a user clicks on a feature in the map. Configure these under "Popup Template".
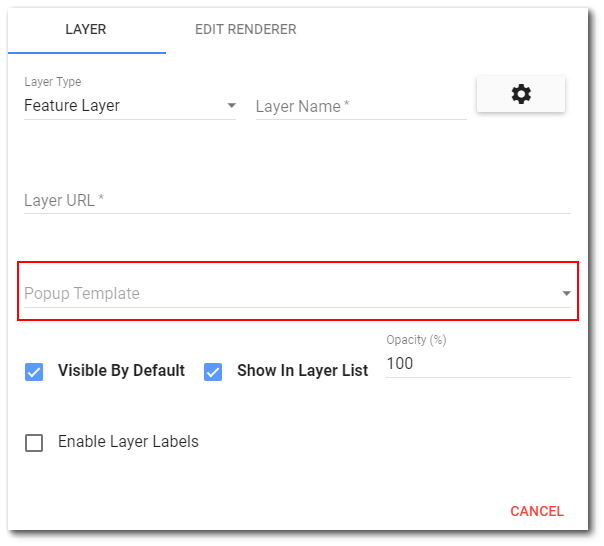
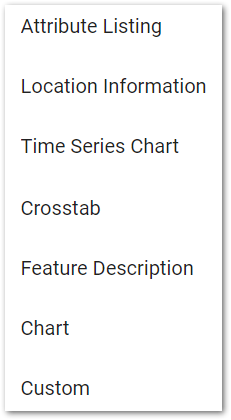
Available options Include:
- Attribute Listing: Displays all output values from the report.
- Location Information: Similar to Attribute Listing, with added file links.
- Time Series Chart: Add dynamic time series charts.
- Crosstab: Displays a crosstab report.
- Feature Description: Select to display the Attribute Listing.
- Chart: Create charts using Esri Charts.
- Custom: Design a custom popup using JSON.
For custom popups, use the JSON editor to define the title and content.
Custom Renderers: Defining Visual Style
Control how your data appears using custom renderers. Available for Facility, My EQuIS facilities, Feature, CSV and User Report layers.

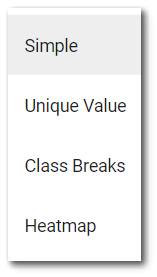
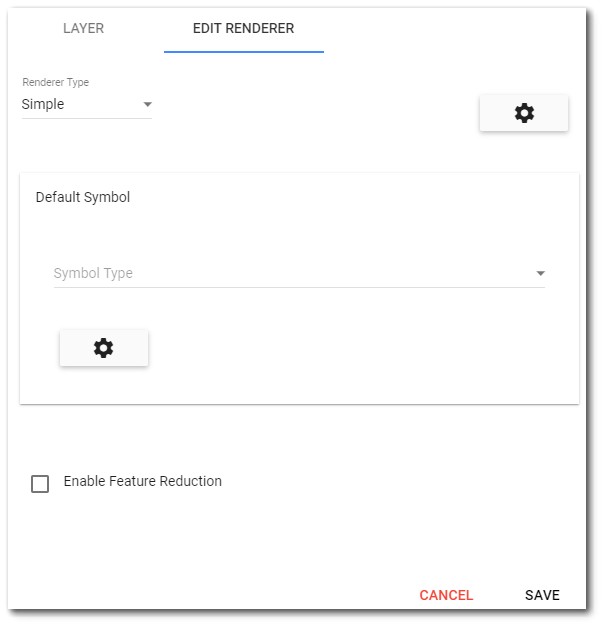 Renderer types:
-
Simple: Use a single, defined symbology.
-
Unique Value: Display different symbology based on an attribute field.
-
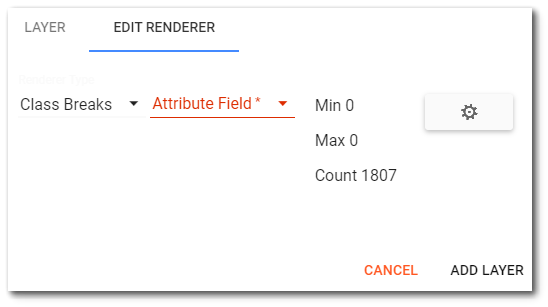
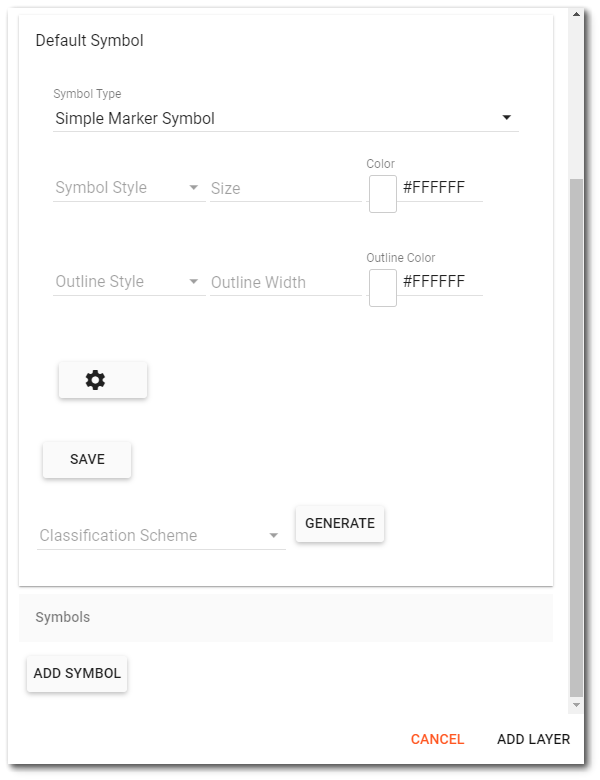
Class Breaks: Group values into classes and assign symbology based on those classes.
-
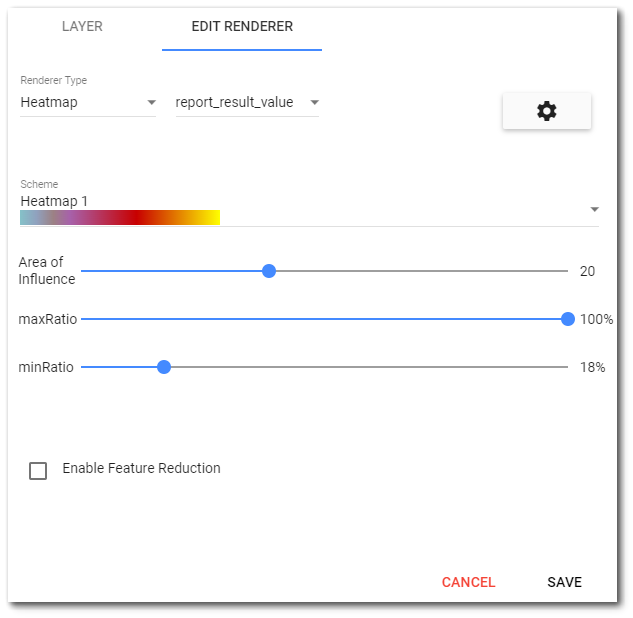
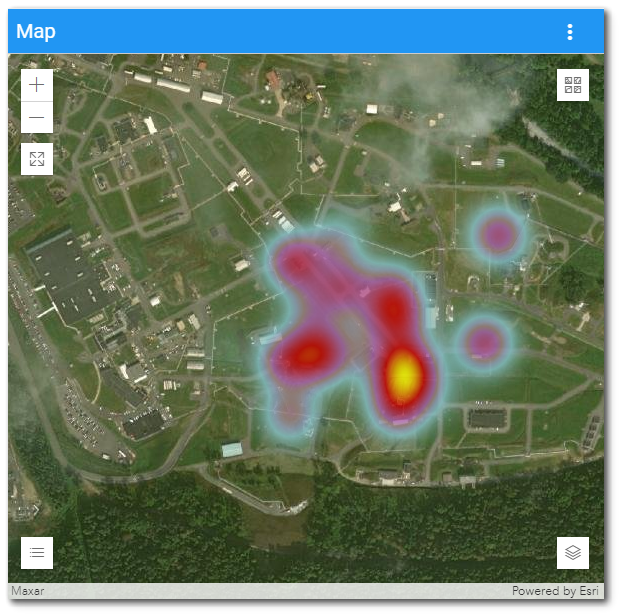
Heatmap: Display data density as a color gradient.
For Class Breaks renderers:
- Choose an "Attribute Field" to filter.
- View "Min", "Max", and "Count" values for the field.
- Select a "Classification Scheme": Equal Interval, Defined Interval, Quantile, or Manual.

For Heatmap renderers:
- Choose an attribute field.
- Select the heatmap color scheme.
- Define the area of influence, maxRatio, and minRatio to shape the visual representation.
Setting the View Order of Map Layers
The order in which layers are listed determines their display priority. Layers at the top of the list are drawn on top of layers below them. Ensure that the data is easily readable by properly using the order.


Conclusion
By mastering the Map Widget Editor Layers tab in EarthSoft, you can create powerful and informative visualizations of your environmental data. Experiment with different layer types, labels, popups, and renderers to tell compelling stories with your maps. Remember to leverage EarthSoft map widget layer options to optimize the display and interpretability of your geospatial data!


